
Automated testing is essential to any robust Software Development Life Cycle (SDLC). Cypress stands out among the many automated testing tools available for its ease of use, versatility, and natural browser execution capabilities. It gains even more power when employed for visual regression testing. This technique compares the visible appearance of web elements before and after changes, ensuring that new code doesn’t disrupt existing layouts or designs.
This article provides insights and techniques for debugging regression tests using Cypress, making your testing efforts effective and efficient.
Table of Contents
How To Debug Regression Tests With Cypress?
Debugging regression tests in Cypress can be challenging, especially if you have a large codebase with many test cases. However, Cypress provides various features that can help you debug. Here are some steps and techniques for effectively debugging regression tests with Cypress.
Cypress Dashboard
The Cypress Dashboard is a comprehensive interface for monitoring and managing your automated tests. One of its key features is that it provides an incredibly detailed view of each test execution, acting as a centralized hub for debugging and analysis. When a test runs, the Dashboard captures and presents real-time data in a user-friendly format, which can be crucial for developers and QA teams. This includes snapshots taken at various test stages, offering a visual step-by-step account of what happened during each test. This can be particularly useful for identifying the point at which a test failed or behaved unexpectedly.
In addition to snapshots, the Cypress Dashboard also provides logs that give you in-depth information about the internal operations of your tests. These logs help you trace back to any anomalies or errors that might occur during the test execution, making the debugging process more straightforward. Command logs show every action executed, such as API calls, DOM manipulations, or any other operations that your test performs. By showing these commands in the completed sequence, the Dashboard offers a coherent and organized view of the test flow, making it easier to spot inefficiencies or unnecessary steps.
Time Travel
One of the most compelling features of Cypress is its “time travel” capability, facilitated through its Test Runner’s command log. This feature is a boon for debugging and understanding how your tests interact with your application. Essentially, time travel allows you to hover over each command listed in the command log to see the exact state of your application at that particular step in the test. It is as if you are stepping through a recorded video of your test but with the added benefit of being able to inspect various aspects of your application at each of those moments.
It means that you can examine the state of specific HTML elements, scrutinize network requests, and observe any other activities your test performs, all at each test step. The time travel feature provides a sort of ‘debugging microscope,’ allowing you to zoom in on the most minute details of your test execution. This becomes extremely helpful for diagnosing failures or unexpected behaviors, as you can effectively replay the test to see exactly what led to a given issue.
Test Isolation
Test isolation is fundamental in software testing, allowing for more focused and effective debugging. Cypress supports this practice effectively with its `it. Only` method, a built-in feature that lets you run a single test case in isolation. This can be incredibly useful when you have an extensive suite of tests and must diagnose why a particular test fails or behaves unexpectedly. The syntax is straightforward, as shown in the example:
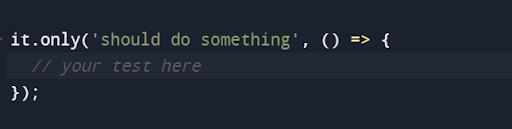
It’s important to note that while focusing on a specific test is helpful for debugging, you should remove the `it. Only` method once the debugging is complete to ensure all difficulties in your suite are executed in the future.
Use `cy.pause()` and `cy.debug()`
The `cy. pause()` and `cy. debug()` commands in Cypress offer distinct but complementary ways to enhance your debugging experience during test automation. The `cy. pause ()` command puts a breakpoint into your automated test. When Cypress reaches this command, it halts execution, allowing you to inspect the state of your application manually. The Cypress UI provides controls for you to step through commands one at a time or resume normal execution. This is immensely useful when dealing with complex issues and examining different parts of your application’s state before proceeding. Imagine it like hitting the “pause” button while watching a film, letting you scrutinize the details of a particular scene before moving on.
On the other hand, the `cy.debug()` command outputs debugging information to your browser’s console. Including the current state of the DOM, details about web elements, or any other variables within scope. While `cy.pause()` lets you explore your application manually, `cy.debug()` gives you a snapshot of information at a particular point in time, which you can review later to understand what was happening in your application when the test reached that line of code. Let’s understand this with an example code.
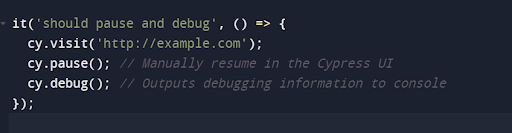
Here, Cypress will first navigate to the specified URL. It then pauses, allowing you to inspect elements, check network requests, or perform manual checks. Once you resume the test, it will hit the `cy.debug()` command and output debugging information to your console, offering another layer of debugging detail.
Console Logging
Using `console.log` statements in conjunction with Cypress commands offers an additional debugging and data inspection avenue. While Cypress provides specialized controls like `cy.debug()` for outputting debugging information, good old-fashioned `console.log` can still be extremely useful for custom logging. The advantage of this approach is the ability to tailor your debug output to show precisely the information you’re interested in, making it easier to zero in on issues.
Adding `console.log` statements at various points in your test suite can serve as “checkpoints,” giving you insight into the state of your application at those specific moments. You could log variables, print out the state of an HTTP request, or even record the time it took for a particular operation to execute. Since these logs get printed to the browser’s console, they are easily accessible for real-time inspection during test execution or later analysis if you persist in your console output.
However, it’s worth mentioning that excessive use of `console.log` could clutter the console output, making it harder to sift through the information. Therefore, it’s advisable to use it judiciously and remove or comment out the log statements once the debugging is complete to maintain readability and performance.
Check Network Requests
Monitoring network requests and responses is crucial to end-to-end testing, especially in today’s highly interconnected application landscapes. Cypress’s `cy.intercept()` function offers a powerful way to intercept and examine network activity between your application and its backend services. This allows you to understand how your frontend code interacts with backend APIs, helping you to verify that these interactions are functioning as expected and diagnose issues. This is the example for better understanding:
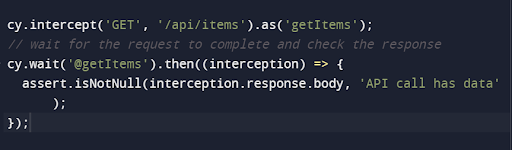
Here, cy.intercept() intercepts all GET requests made to the /api/items endpoint and aliases this intercepted request as getItems. The cy.wait() function then waits for this aliased request to complete before continuing with the test. The response is made available in the .then() callback as an interception, which you can then inspect to check the integrity, structure, or even the existence of the data returned from the API. This level of network inspection is precious for debugging and understanding complex scenarios.
For instance, if your frontend application is not displaying data as expected, you can use cy.intercept() to determine whether the issue lies in the frontend code or stems from incorrect or unexpected data returned by the backend API. Additionally, you can mock API responses to simulate different backend behaviors, enabling you to test how your application handles various scenarios, such as data inconsistencies or errors.
Watch Test Execution
Watching live test execution is an essential feature that enhances your debugging capabilities, and Cypress offers two modes to accommodate different needs: headed and headless. Running tests in the headed way via the `cypress open` command launches the Cypress Test Runner in an interactive GUI. This lets you view your tests as they execute in real-time within a browser, giving you a first-hand look at how your application behaves during testing. In contrast, headless mode (`cypress run`) is designed for automated test execution, often as part of a Continuous Integration (CI) pipeline, and doesn’t visually display test execution.
The benefit of using headed mode is akin to having a live camera feed directly into the behavior of your application under test conditions. You can see the sequence of actions carried out, how the DOM responds to these actions, and any visual cues such as pop-ups, alerts, or navigation changes. This real-time feedback is invaluable for understanding your tests’ flow, capturing visual regressions, and debugging issues that may not be easily replicable outside the test environment.
However, it’s crucial to note that while headed mode offers more interactive debugging capabilities, it may run slightly slower than headless mode due to the overhead of rendering the GUI. Therefore, switching back to headless mode is often advisable once the debugging is complete or when you need to run the tests as part of an automated workflow.
Conclusion
Utilizing Cypress for regression testing streamlines the process and ensures you catch bugs early in the development cycle, thus saving time and effort in the long run. However, testing is rarely confined to a single environment or a set of configurations. This is where LambdaTest comes into play. LambdaTest is an AI-powered test orchestration and execution platform that allows you to run your Cypress tests on 3000+ browsers, operating systems, and device combinations.
Integrating Cypress with LambdaTest broadens your testing scope and enhances your confidence in the application’s reliability across different user environments. By taking advantage of both Cypress and LambdaTest, you can build a comprehensive, scalable, and robust regression testing strategy, ensuring that your application’s quality remains consistently high.

I am a passionate, adventurous, and insatiate learner who loves to write about the latest technology trends. My experience working in an MNC has motivated me to understand that there are certain niche requirements for writing strategically about brands’ messages towards people’s interests which I’ve mastered over time through trial and error of many projects under various clients across diverse industries. It is my honest effort to put my experiences and knowledge of industry towards readers.